


ChartsWatcher: guida completa allo scanner di mercato in tempo realeChartsWatcher: the complete guide to the real-time market scanner
Come funziona ChartsWatcher, come costruire scanner, alert, toplist e watchlist su una dashboard multi-finestra, e come partire dalla versione gratuita fino ai piani a pagamento. Guida pratica passo-passo, con i riferimenti alle fonti ufficiali.How ChartsWatcher works, how to build scanners, alerts, toplists and watchlists on a multi-window dashboard, and how to start from the free version up to the paid plans. A practical, step-by-step guide with links to the official sources.
Cos’è ChartsWatcher
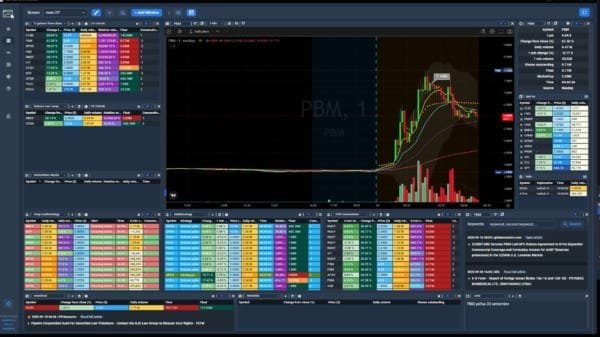
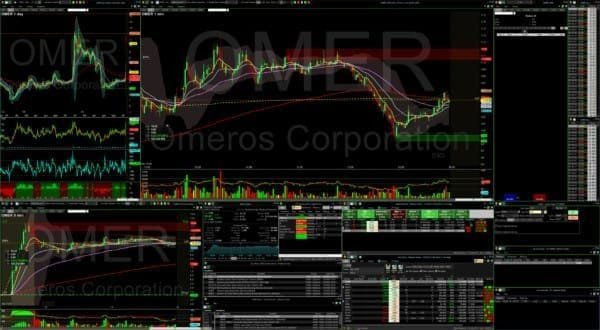
ChartsWatcher è un’applicazione professionale per filtrare e osservare in tempo reale tutto ciò che si muove sul mercato azionario. Sviluppata in Germania, si distingue per dashboard multi-finestra altamente personalizzabili: sullo schermo puoi comporre diverse “tile” (riquadri) di tipi differenti — alert, toplist, grafici interattivi, feed di news e watchlist — e disporle come preferisci.
L’idea di fondo è semplice: invece di guardare centinaia di grafici, definisci le condizioni che ti interessano (movimenti di prezzo, volume anomalo, rotazioni, pattern di candele, dati fondamentali, sentiment sulle news) e lasci che lo scanner faccia emergere solo i titoli che contano in quel momento. È uno strumento pensato soprattutto per chi fa trading di momentum e ha bisogno di reattività.
La dashboard e le finestre (tile)
Il cuore di ChartsWatcher è la dashboard. In alto trovi una barra di controllo con un menu a tendina per selezionare la “screen config” (configurazione di schermata) che vuoi visualizzare: puoi definire un numero praticamente illimitato di screen config diverse — ad esempio una per il pre-market, una per l’apertura, una per lo small-cap momentum.
All’interno di ogni schermata aggiungi le finestre che ti servono. I tipi di tile principali includono:
Come costruire uno scanner passo-passo
Lo scanner in ChartsWatcher si costruisce intorno a una “alert window” alimentata da una configurazione di alert (strategia). Il flusso tipico è questo:
1. Aggiungi la finestra alert
In alto nella dashboard clicca +Add Window e poi Add Alert Window. Questa finestra ospiterà i risultati dello scanner.
2. Crea o scegli una configurazione di alert
Definisci una strategia con una o più condizioni: puoi partire da semplici variazioni di prezzo fino a strategie multi-condizione che combinano indicatori tecnici, dati fondamentali, volume e pattern di candele. Puoi impostare notifiche audio e visive quando una condizione scatta.
3. Aggancia la config alla finestra
Quando la configurazione ti soddisfa, la selezioni nel menu a tendina in cima all’alert window: da quel momento la finestra mostra in tempo reale i titoli che rispettano le tue condizioni.
4. Scegli le colonne e i colori
Per ogni strategia decidi quali colonne di dati vedere. Per ogni colonna con un valore puoi definire uno schema di colori personalizzato, così i valori più rilevanti risaltano a colpo d’occhio.
Toplist: le classifiche in tempo reale
Le toplist sono classifiche dinamiche (per esempio i maggiori gainer, i maggiori loser, il volume più alto). Per crearne una nuova, clicca il pulsante Add in alto a sinistra e configura le colonne che vuoi vedere direttamente nella dashboard. Puoi ordinare la lista per qualsiasi colonna e usarla come punto di partenza per selezionare i titoli su cui approfondire.
Watchlist e colonne personalizzate
La tile watchlist ti permette di gestire i titoli importanti per la tua strategia. Anche qui configuri le colonne dati che vuoi monitorare e ordini la lista come preferisci. La logica delle colonne personalizzate (con schemi di colore) vale in tutta l’app: è ciò che rende ChartsWatcher adattabile a stili di trading molto diversi, dallo scalping al swing.
Template e configurazioni predefinite
Non sei obbligato a partire da zero. ChartsWatcher mette a disposizione screen config, alert e toplist predefinite: sono un ottimo punto di partenza da cui capire l’interfaccia e poi personalizzare. Il consiglio pratico è usare i template di default come base, modificarli un pezzo alla volta e appoggiarsi alla documentazione e ai tutorial ufficiali per le funzioni più avanzate.
Piani e prezzi
ChartsWatcher offre un piano gratuito e tre piani a pagamento (Starter, Advanced, Pro), con pagamento mensile o annuale. Gli importi variano per Paese e valuta e possono cambiare, quindi il prezzo aggiornato lo trovi direttamente sul sito ufficiale di ChartsWatcher.
Come iniziare (workflow consigliato)
- Parti dalla versione gratuita per familiarizzare con dashboard, finestre e controlli.
- Apri i template predefiniti (screen config, alert, toplist) e osserva come sono costruiti.
- Costruisci il tuo primo scanner: +Add Window → Add Alert Window → aggancia una strategia di alert.
- Personalizza colonne e colori per far risaltare ciò che conta per il tuo stile.
- Aggiungi grafico e news nella stessa schermata, così passi dallo scan al contesto senza cambiare finestra.
- Quando sei pronto all’upgrade, valuta Starter/Advanced/Pro in base a quanto ti servono i dati rapidi, e applica SAVE10.
Prova ChartsWatcher (gratis, poi 10% OFF con SAVE10)
Scanner in tempo reale per momentum, volume anomalo e rotazioni. Inizia dalla versione gratuita, poi sblocca il 10% di sconto sul primo periodo a pagamento con il codice SAVE10.
Vai a ChartsWatcher Registrati e usa SAVE10Domande frequenti
ChartsWatcher è adatto ai principianti?
Sì, ma con curva di apprendimento: la versione gratuita e i template predefiniti aiutano a partire, mentre le funzioni multi-condizione danno spazio a strategie avanzate quando sei pronto.
Serve un abbonamento per iniziare?
No. Puoi partire dalla versione gratuita senza carta di credito e passare a un piano a pagamento solo quando ti servono più funzioni o dati più rapidi.
Che differenza c’è tra i piani?
Le differenze principali riguardano le funzioni avanzate e la rapidità dei dati (per esempio i grafici a 10 secondi). Verifica sempre il dettaglio aggiornato sul sito ufficiale.
Fonti
- Sito ufficiale ChartsWatcher: chartswatcher.com
- Tutorial ufficiali (dashboard, alert, toplist): blog e canale Medium di ChartsWatcher.
What ChartsWatcher is
ChartsWatcher is a professional application to filter and watch, in real time, everything that moves in the stock market. Developed in Germany, it stands out for highly customizable multi-window dashboards: on screen you can assemble different “tiles” of various types — alerts, toplists, interactive charts, news feeds and watchlists — and arrange them however you like.
The core idea is simple: instead of staring at hundreds of charts, you define the conditions you care about (price moves, unusual volume, rotations, candle patterns, fundamental data, news sentiment) and let the scanner surface only the tickers that matter right now. It is a tool built above all for momentum traders who need to react quickly.
The dashboard and the windows (tiles)
The heart of ChartsWatcher is the dashboard. At the top there is a control bar with a dropdown to select the “screen config” you want to view: you can define a virtually unlimited number of different screen configs — for example one for the pre-market, one for the open, one for small-cap momentum.
Inside each screen you add the windows you need. The main tile types include:
How to build a scanner, step by step
In ChartsWatcher a scanner is built around an “alert window” powered by an alert configuration (strategy). The typical flow is this:
1. Add the alert window
At the top of the dashboard click +Add Window and then Add Alert Window. This window will host the scanner results.
2. Create or pick an alert configuration
Define a strategy with one or more conditions: you can start from simple price changes up to multi-condition strategies that combine technical indicators, fundamental data, volume and candle patterns. You can set audio and visual notifications when a condition triggers.
3. Attach the config to the window
Once you are happy with the configuration, select it in the dropdown at the top of the alert window: from then on the window shows, in real time, the tickers that meet your conditions.
4. Choose columns and colors
For each strategy you decide which data columns to see. For every column with a value you can define a custom color scheme, so the most relevant values stand out at a glance.
Toplists: real-time rankings
Toplists are dynamic rankings (for example the biggest gainers, biggest losers, highest volume). To create a new one, click the Add button at the top left and configure the columns you want to see directly in the dashboard. You can sort the list by any column and use it as a starting point to pick the tickers to dig into.
Watchlists and custom columns
The watchlist tile lets you manage the tickers that are important for your strategy. Here too you configure the data columns you want to monitor and sort the list as you prefer. The custom-column logic (with color schemes) applies across the whole app: it is what makes ChartsWatcher adaptable to very different trading styles, from scalping to swing.
Templates and default configurations
You are not forced to start from scratch. ChartsWatcher provides pre-built screen configs, alerts and toplists: they are a great starting point to learn the interface and then customize. The practical advice is to use the default templates as a base, change them one piece at a time, and rely on the official documentation and tutorials for the more advanced features.
Plans and pricing
ChartsWatcher offers a free plan and three paid plans (Starter, Advanced, Pro), billed monthly or annually. Amounts vary by country and currency and can change, so you will find current pricing directly on the official ChartsWatcher site.
How to get started (recommended workflow)
- Start with the free version to get familiar with the dashboard, windows and controls.
- Open the default templates (screen configs, alerts, toplists) and see how they are built.
- Build your first scanner: +Add Window → Add Alert Window → attach an alert strategy.
- Customize columns and colors to make what matters for your style stand out.
- Add a chart and news to the same screen, so you move from scan to context without switching window.
- When you are ready to upgrade, weigh Starter/Advanced/Pro by how much you need fast data, and apply SAVE10.
Try ChartsWatcher (free, then 10% OFF with SAVE10)
Real-time scanner for momentum, unusual volume and fast rotations. Start with the free version, then unlock 10% off your first paid period with the code SAVE10.
Go to ChartsWatcher Sign up and use SAVE10Frequently asked questions
Is ChartsWatcher suitable for beginners?
Yes, but with a learning curve: the free version and the default templates help you start, while the multi-condition features leave room for advanced strategies when you are ready.
Do I need a subscription to start?
No. You can start with the free version without a credit card and move to a paid plan only when you need more features or faster data.
What is the difference between the plans?
The main differences concern advanced features and data speed (for example 10-second charts). Always check the up-to-date detail on the official site.
Sources
- ChartsWatcher official site: chartswatcher.com
- Official tutorials (dashboard, alerts, toplists): ChartsWatcher blog and Medium channel.